In the marketing world, the business conversion rate is marketing with the purpose of increasing conversions. Good conversions mean a strong ROI.
Every small business owner running an e-commerce site has a dream of growing their online business to rival all the big names. Everyone dreams to have thousands of customers daily, monthly revenue in millions, and a feature on the cover of fortunes. All of this can be achieved by increasing your business conversion rate.
The dream is familiar ….
I am sure you all have the same dream to achieve, but growing a small business is not an easy task. Initially, it looks easy but the actual process is quite complicated. You need to take care of the daily operations such as stocking products, arranging shipping and logistics, sourcing the best price, and so on.
You need to be flexible to adjust to your user expectations and antedate their needs. In the case of e-commerce stores, customers physically disconnect from their purchased items – this is the gap we need to seal. Just bringing more visitors to your website won’t help. You need to do measurable improvements unless the content gains trust and encourages potential customers to purchase your products or services.
To achieve revenue growth, CRO focuses on:
-
- Providing a better UX
- Relevant and engaging content
- Increase visitor’s motivation
But, what is CRO?
Customer rate optimization is the process of boosting the percentage of visitors to take the desired action. CRO has the objective to understand what content and encouragement customers need to buy your products and services. When properly implemented, CRO strategy goes hand in hand with your SEO efforts. So, instead of an SEO replacement, CRO should be considered as an SEO multiplier. Improvements that CRO makes to your content will also make your website more SEO-friendly.
Let’s start from scratch.
What is Business Conversion Rate?
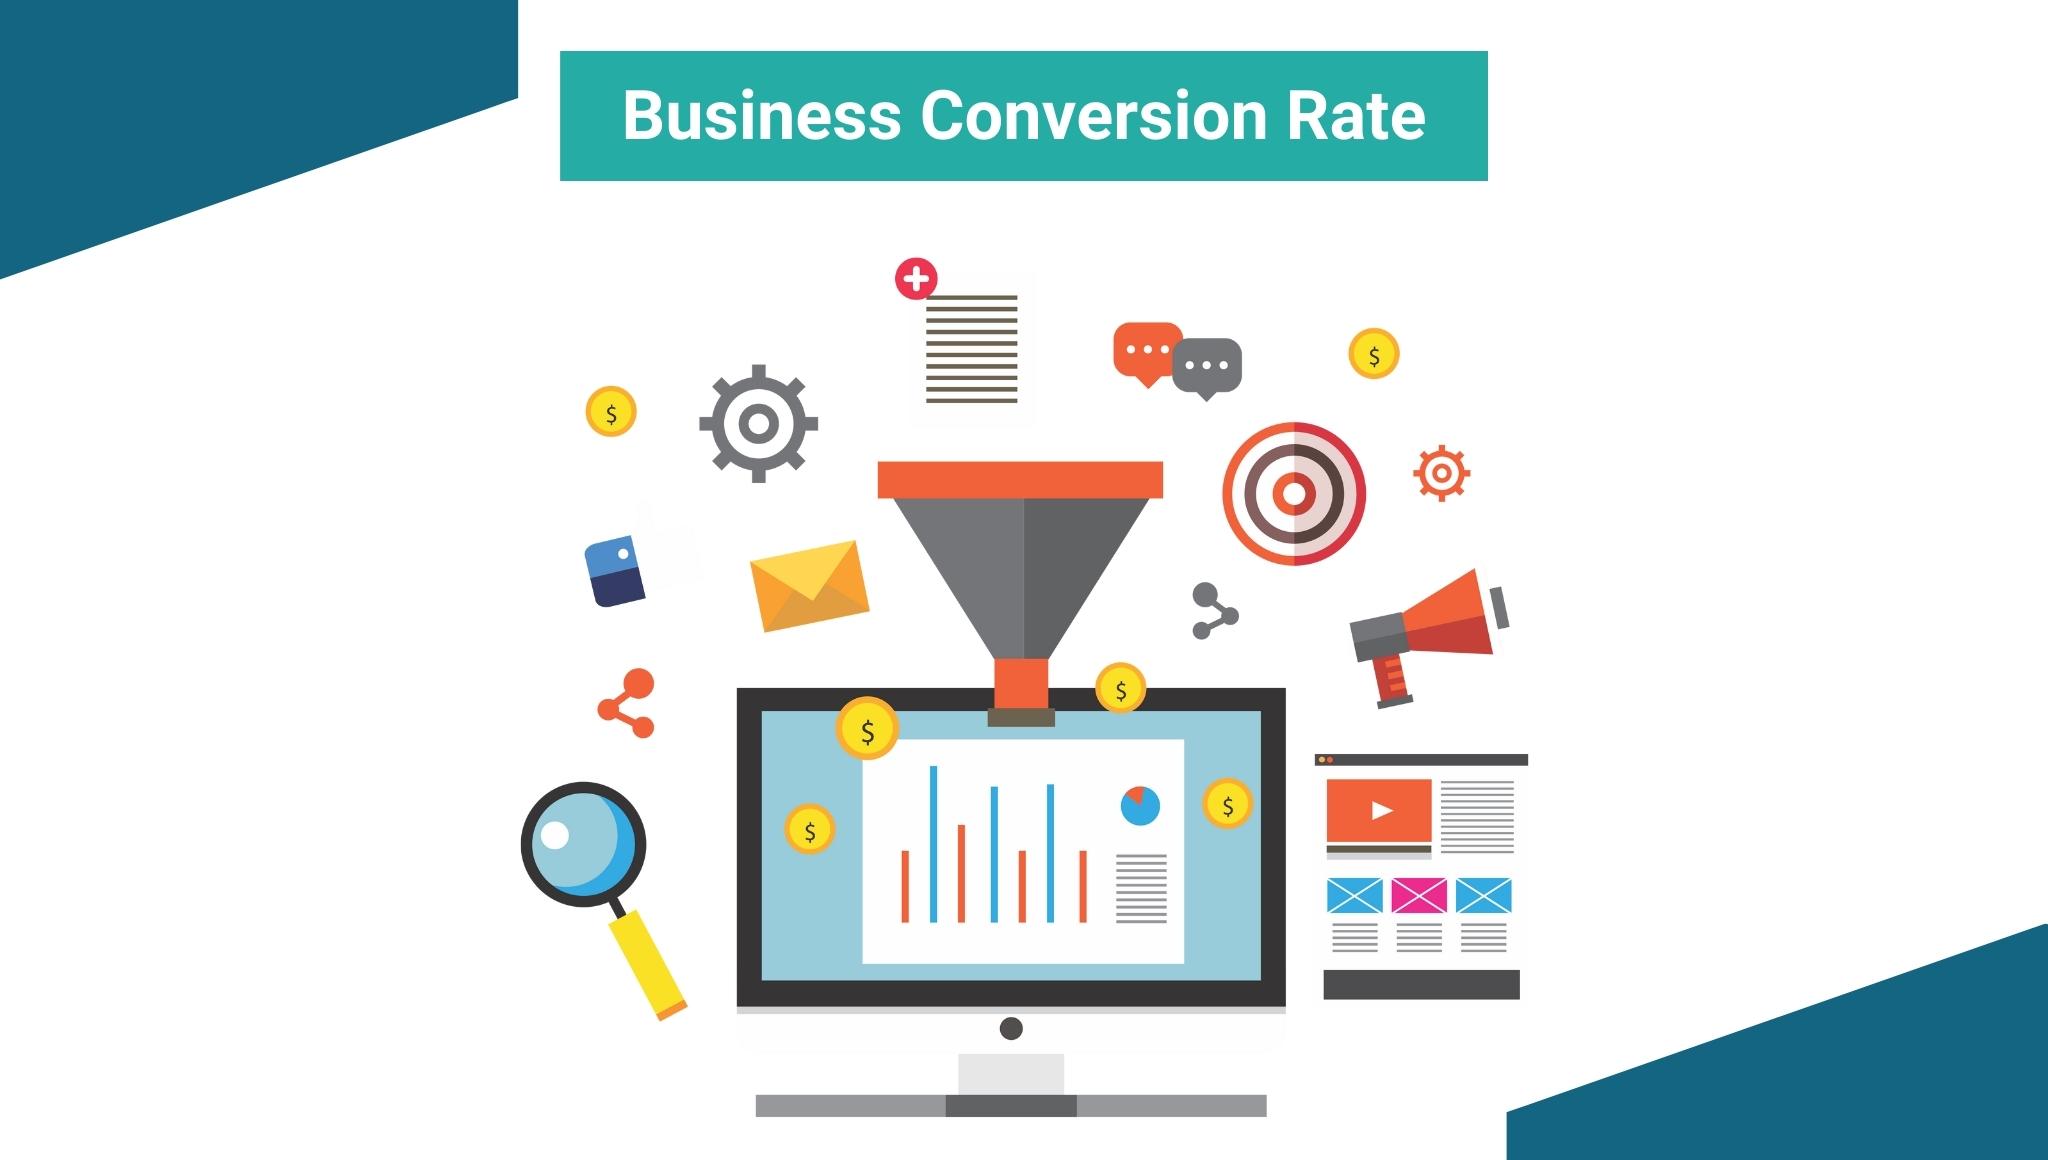
The percentage of customer actions taken after total clicks on displayed ads is termed the conversion rate of a business. Conversion rate measures the number of people who converted as a percentage of the total number of users that visited your website. Digital marketing strategy defines your actions such as clicking on a link, opening an email, filling out a registration form online, downloading an asset, buying a product, signing up for a special retail offer, or giveaways.
Formula is:
Conversion rate = (conversions / total visitors) * 100%
Each conversion brings a visitor one step closer to becoming a potential customer. With the right web analytics and conversion tools, you can convert more of your visitors into prospects and then into customers. The higher your conversion rate, the more effective your content, and the more successful your online campaigns.
Why does Conversion Rate matter to your business?
Conversion rate allows you to determine how effective your marketing strategies are. It is one of the most accurate metrics that compare the conversion rate with the number of customer responses to the total number of contacts.
Just imagine, if you had 60 people sign up for last month, your first instinct would probably be to celebrate.
You might rethink that response if you find out that those 60 people came from more than 60,000 who visited your site. Sadly, that’s only a 1% conversion rate.
A good conversion rate means a good return on investment. Having a high business conversion rate is the foundation of high sales volume. If your business conversion rate is decreased, then your ROI would likewise decrease and if this happens, then you might change your marketing strategy.
What’s Qualitative Analysis?
Qualitative analysis is a process of gathering, structuring, and interpreting qualitative data to know what it represents. It utilizes subjective judgment to analyze a business value based on non-quantifiable information. It deals with inexact, non-numeral, and unstructured information that is not easy to collect and measure. It helps you to understand people and industry culture. It also allows you to look at the company through the eyes of the customers and understand its competitive advantage assists.

Businesses mostly perform this analysis based on user feedback which includes reviews, chat messages, complaints, support center interactions, customer interviews, and social media comments.
Qualitative analysis and quantitative analysis are used together to examine a company’s operations and evaluate its potential as an investment opportunity.
How to increase business conversion rate with qualitative analysis?
Checking a large number of Qualitative Data can be a challenging task but with a little preparation and a few simple steps, it becomes easier to draw insights.
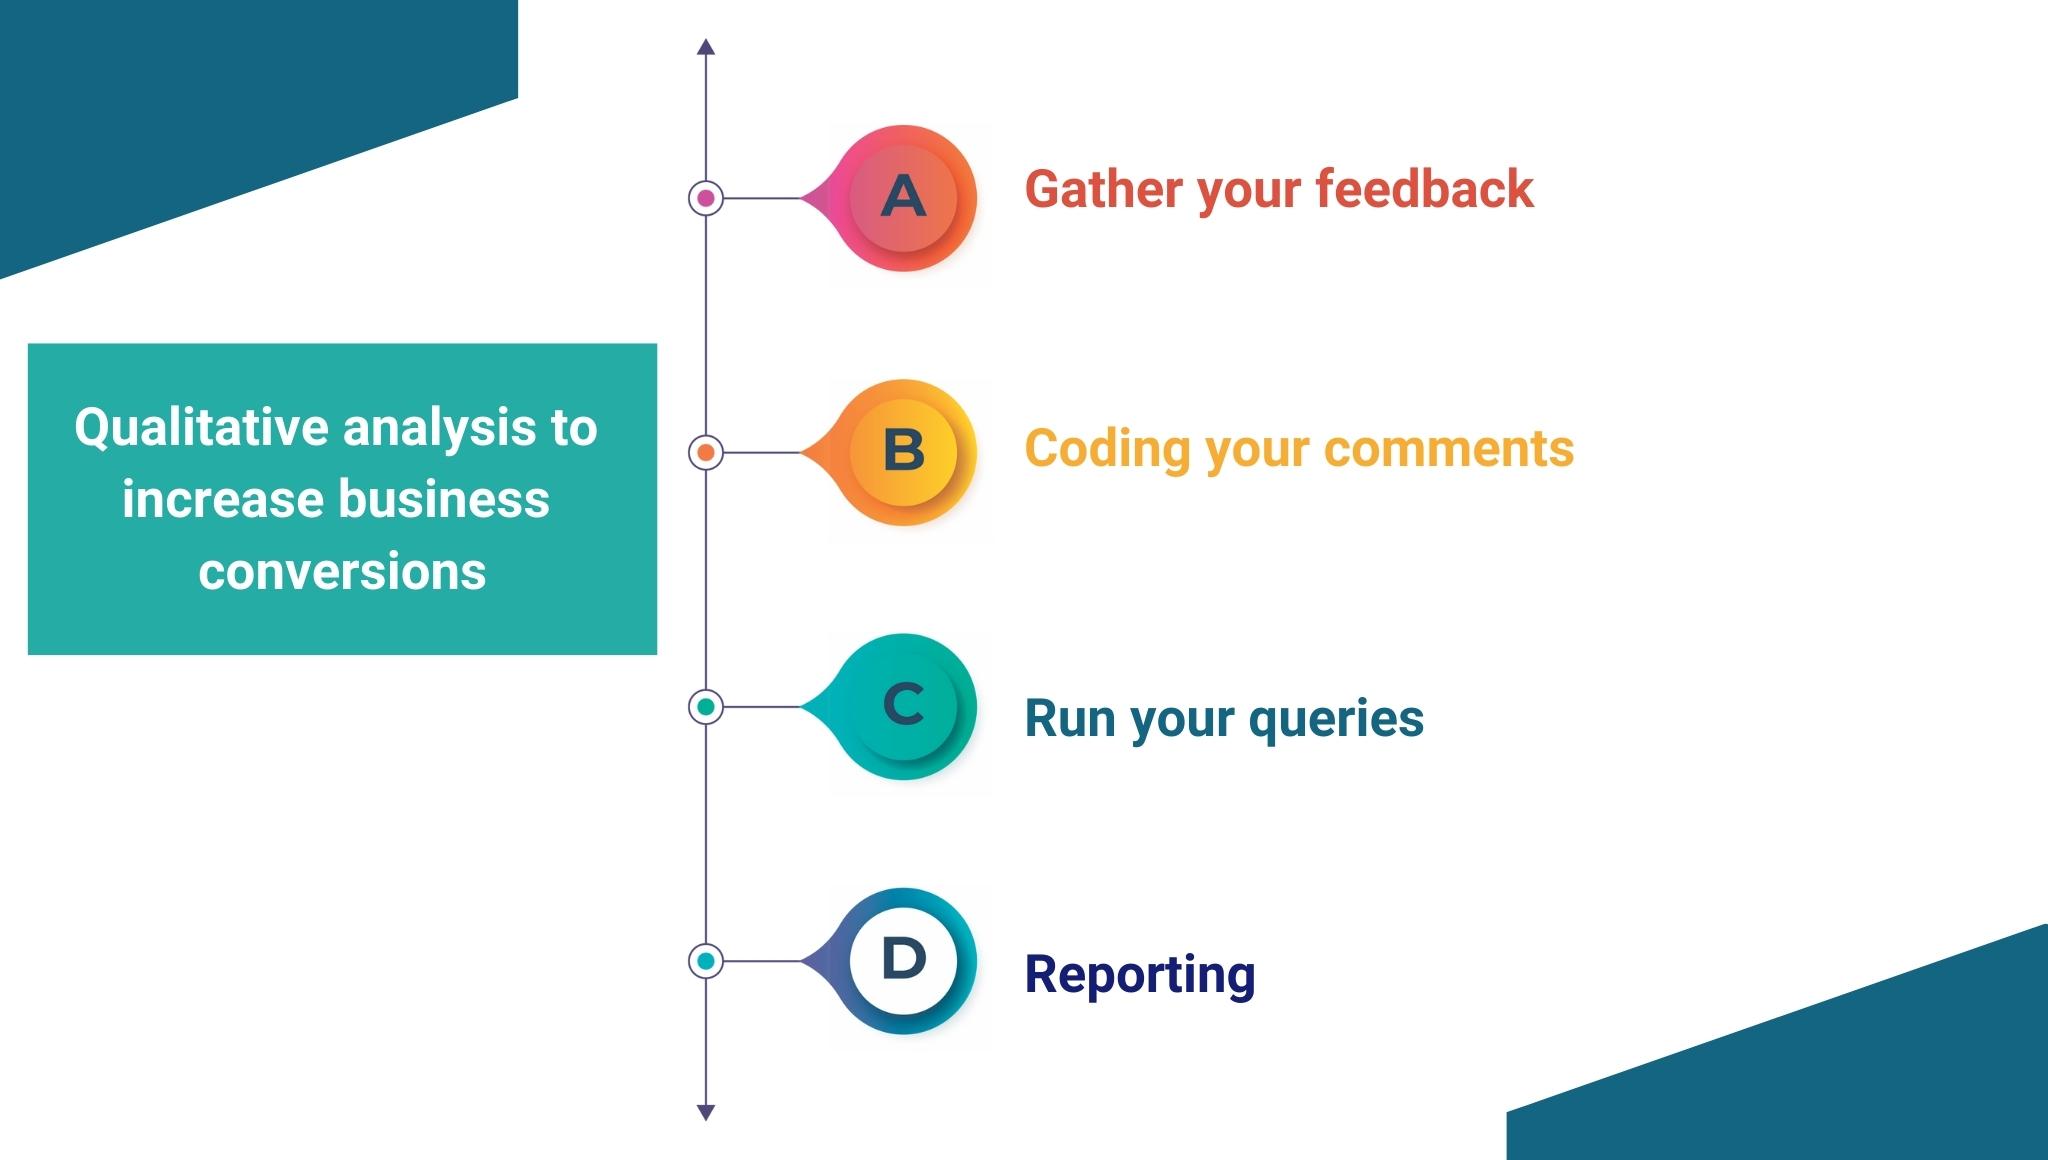
Today, we will look at the simple steps to perform qualitative analysis to organize and code qualitative data.
-
Gather your feedback
The first step for conducting a qualitative analysis of your qualitative data is to collect all the information such as comments and feedback which you want to analyze. This data is available in different formats such as on post-it notes, on paper, or on various forums and surveys, so it’s important to gather all of your data in a single piece. To organize your content, you can use a master spreadsheet as a place to collect all of your comments and feedback, or you can set up your analysis template.
-
Coding your comments
The next step in qualitative analysis is about coding your comments and most importantly reading; making a decision on how each one should be organized.
There are two methodologies to approach this:
- The first way assumes that you are looking for a predefined set or list of themes or issues. In this method, it is important you articulate your coding legend. A better way to do this is by creating a simple table outlining what each code is and what it covers. This can be mapped to the areas you need to report on or the key components of your project.
- The other way is focused on unpacking themes without having any prior expectations about what they should be. In the first method, it is important you articulate your coding legend. A better way to do this is by creating a simple table outlining what each code is and what it covers. This can be mapped to the areas you need to report on or the key components of your project.
-
Run your queries
Once you are done coding all of your data it is time to run your queries. It means you need to check the insights of your data. Your reporting requirements will identify the extent and type of queries you run during this process.
Here are a few queries you run on your data:
-
- Which are the most commonly used codes or themes? Represent this visually in order to get a sense of the most crucial areas.
- How did people respond through different formats? Were there any variations in views based on the submission type?
- Which issues are of more concern to different demographic segments?
- Are there any relationships between issues?
Represent this visually to get a sense of the most crucial areas.
-
Reporting
Now that you have run queries and explored your data you have a solid foundation and enough insight to begin your reporting. Reporting is the final step in your findings. This is a challenging step as it’s your turn to tell the story of what you have learned from your consultation. If you fail to perform this step well, your community will lose trust in your process and you might also face a community outrage. Being on time and transparent is the best way to avoid this type of situation. Utilize your insights to create a narrative about the issues and opportunities your community has identified.
While framing your insights you might consider using the following as useful ways of quantifying your findings:
-
- Check what concerns were frequently raised by the participants
- See what most of the participants have commented
- Find out what most of the participants have suggested
You can utilize relative charts and visuals to help your community further explore your data. Once you have compiled and circulated your data, it’s better. Better to ask your community for their final comments. At this stage, you can check whether you have framed their concerns and issues correctly or not.
You can decide to make any final changes if required before submitting the final report. Magic tools to collect qualitative data.
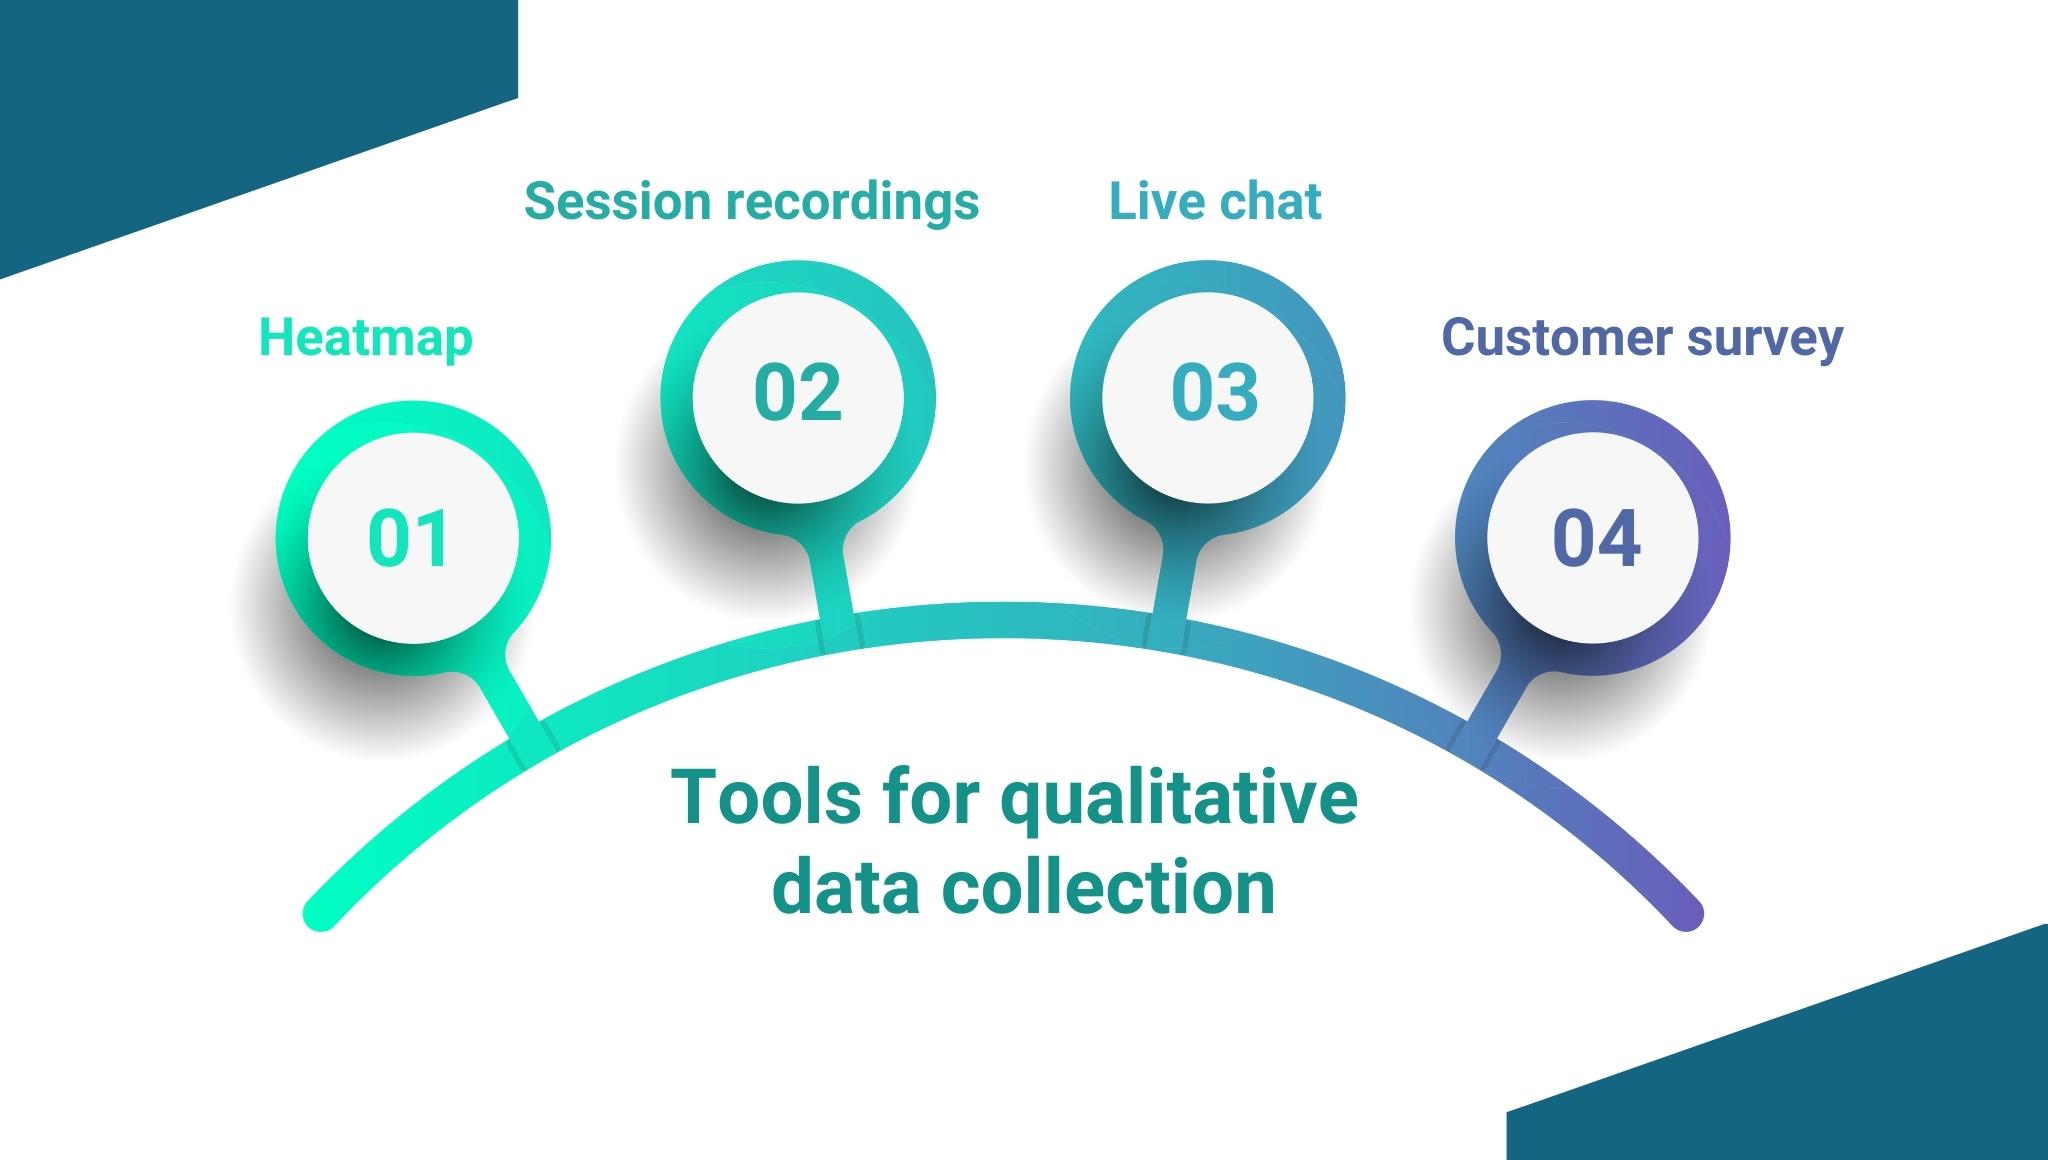
Here are a few magic tools you can use to gather qualitative data.
-
Heatmap
It helps business owners to understand how customers are interacting with their site. Heatmaps show what people are clicking, it helps to determine what elements are converting and what are not. It analyzes the behavior of your visitors and helps you to decide where to place the best call-to-action button online. Heatmap shows the customer interactions with colored spots, where the visitors scroll the mouse, where the visitors click, and from where the visitors left the page.
Heatmaps can be extremely useful for tracking shopping cart abandonment. It would give a clear idea of which products are your visitors clicking on, whether are they scrolling down the page, how are they moving about your conversion funnel, what is their reaction when they come on the checkout page, and what is exactly making them leave your online store. It is one of the main tools which provides amazing insight into your site visitors, which is why it is a must to put a heatmap on your online website.
-
Session recordings
Session recording lets you see your site from the eyes of a visitor and helps you to understand what made them leave or purchase. You can watch the recording of their individual browsing journey to find out why you are losing them. It allows you to find the issues with your website and help you fix them to increase the business conversion rate.
-
Customer survey
A micro survey gives you detailed feedback on what and how your customer thinks about your online site, however it highly depends on what type of questions you ask in the survey.
You need to keep the following things in mind while designing a customer survey
- Ask only important questions, avoid long and irrelevant questions
- Keep your survey short and to-the-point
- Make it smart to gather some necessary details
- Do not push your customers to answer in a way you want them to answer, avoid biases.
- Have more yes/no – it is easy and time-saving too.
- Timing is important – conduct a survey when you think your customers would participate for sure.
- Offer perks, and incentives to make them fill and take your surveys seriously.
-
Live chat
Live chat can grab a higher number of customers in today’s world. There is no more B2B or B2C anymore, this is the world of H2H: Human to Human. Having online customer service is the best way to promote your brand and convert your customers effectively. Most of the customers prefer live chats to share their issues.
Ensure that an expert is sitting on the other end to satisfy customer needs and fix their problems.
Qualitative tools give you constant feedback from surveys and live chats, higher observations via session recordings, and problem identification to rectify it as soon as possible.
Conclusion
Qualitative analysis allows you to look inside the mind of your customers. You will know what they exactly think, what they want, and, how they want it. If you fail to find out why people are dropping off here and there, Qualitative analysis can help. The qualitative analysis provides you with all the customer demand details and customer interaction.
Numbers and stats are just plain data. Qualitative data have some extremely useful customer insights to help you increase your conversion rate for the longer term.
